A Remote Monitoring and Management platform that reaches well past classic server monitoring. From one console: endpoint management, automation, inventory, backup verification, cybersecurity and compliance reporting, and full remote management. Covers Windows Server, Windows desktops, macOS, and Linux.
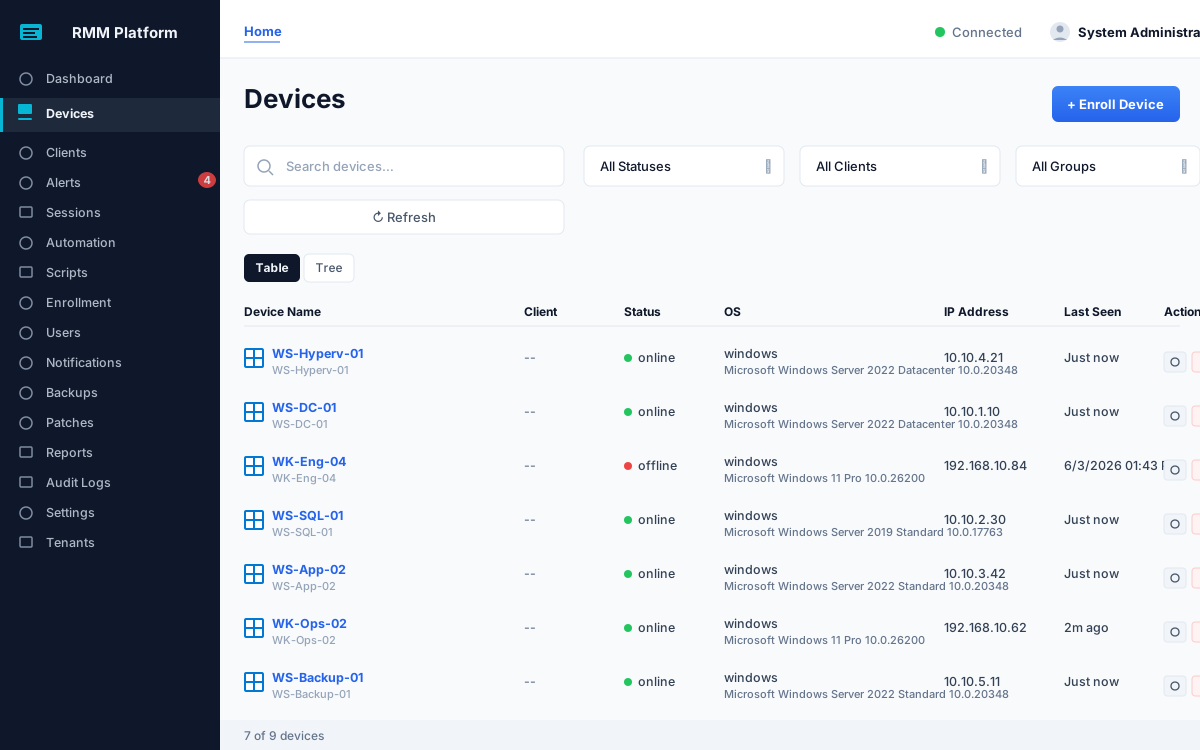
Netaxis RMM gives operators one console for what MSPs and IT teams need from an RMM. Real-time monitoring, endpoint management, automation, inventory, backup verification, cybersecurity and compliance reporting, and remote management. All of it across Windows Server, Windows desktops, macOS, and Linux.
One workspace showing every managed server and endpoint. Windows Server, Windows desktops, macOS, and Linux, all in a single view.
Operators see what's happening across the whole managed estate in one place, without bouncing between vendor consoles.
Lightweight built-in tracking for the things operators actually need day-to-day. Internal notes, status flags, and routine checks alongside the automated data.
Netaxis RMM is designed to run self-hosted on your own infrastructure, the same way it runs in production today, and can also be operated as a managed instance.
Scope and defaults come from actually running the environments this platform manages. Hosting, patching, backups, and fleets of servers and workstations, day in and day out.
Run it on your own infrastructure, or have it operated as a managed instance. Built on Node.js, TypeScript, and SQL, so any experienced team can maintain and extend it.
A lightweight agent on each device reports back in real time. Online status, CPU and memory, running services, installed patches, and full hardware inventory.
Open any monitored device for a full picture: live metrics, running processes and services, alerts, recent sessions, login activity, pending updates, and quick-command execution. One console, no separate tools required.
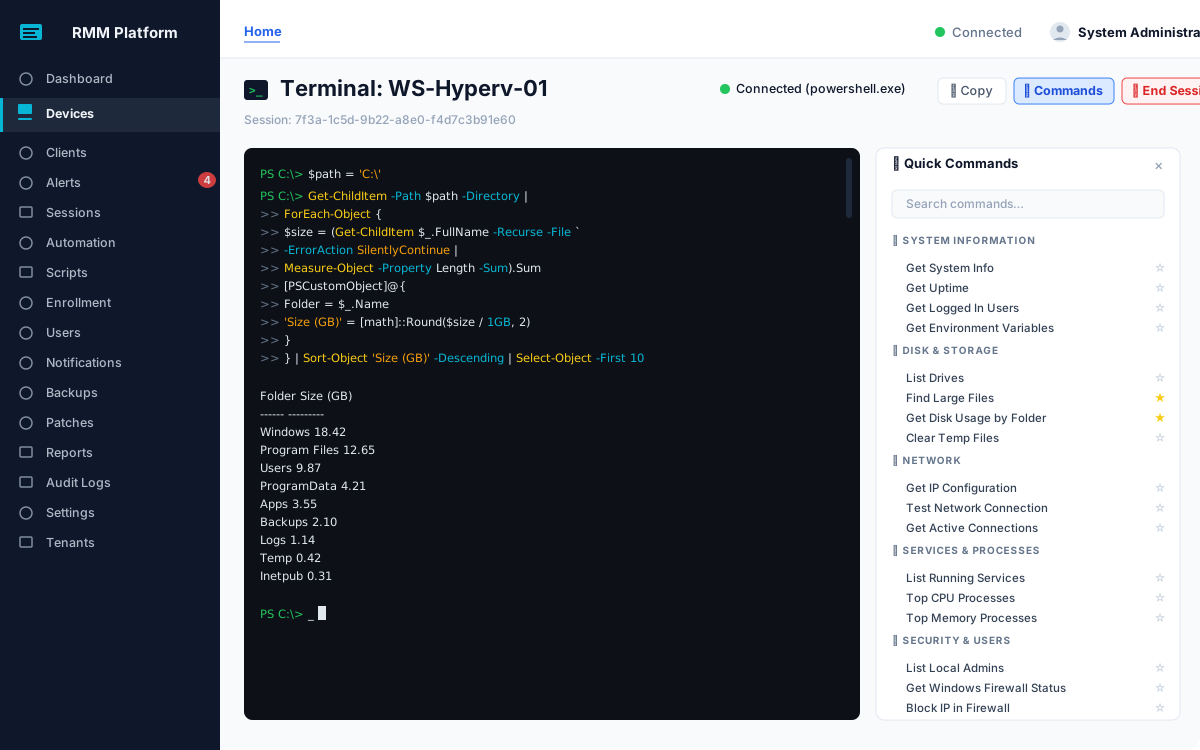
Open a live PowerShell session against any managed Windows device right from the console. No RDP, no third-party shell. A built-in library of pre-written Quick Commands covers system info, disk usage, network checks, services, processes, and security tasks, so common admin work is one click instead of one remembered cmdlet.
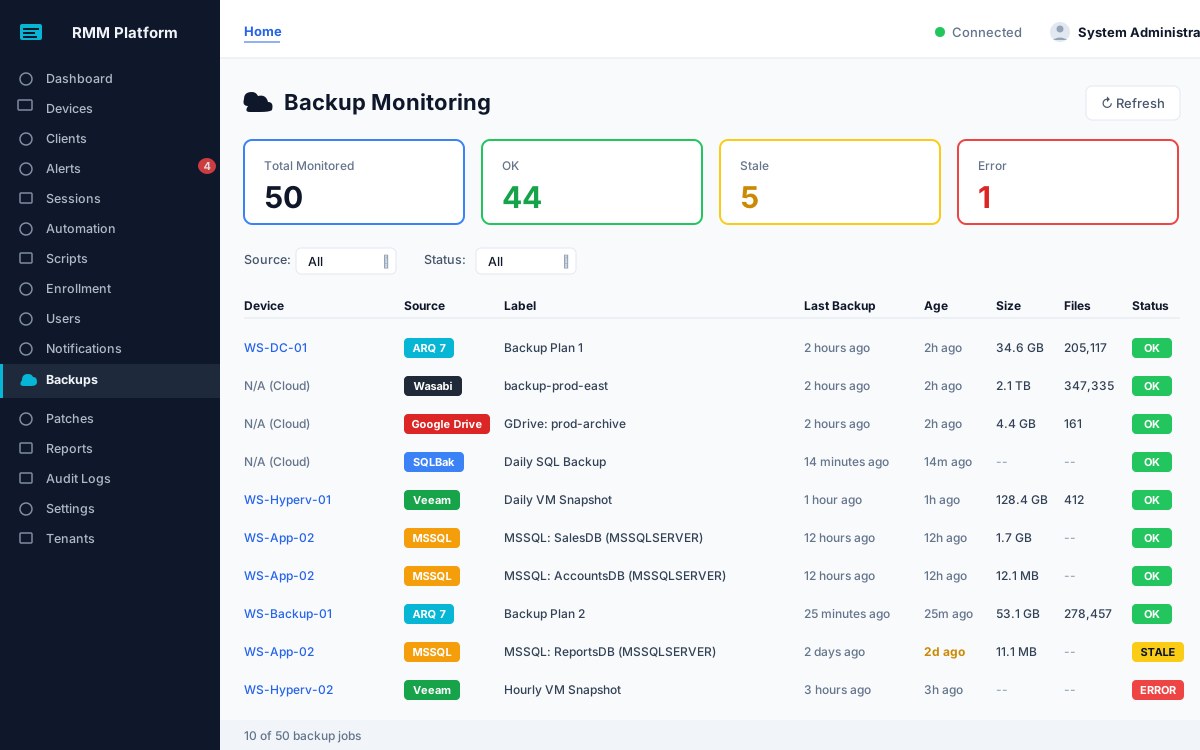
Goes beyond "did it run." Verifies backups across ARQ, Veeam, SQLBak, Wasabi, and Google Drive. Checks the right size, the right schedule, and whether the file actually opens, so a silent shrinkage doesn't surprise you on the day you need it. Microsoft SQL Server is monitored straight from SQL's own backup logs, which means it works with whatever backup tool you're already using. No vendor-specific add-on required.
Every login uses token-based authentication, with role-based permissions and full audit logging, so each person sees and touches only what they should. Least privilege by default.
Agents authenticate with a unique per-device token and poll outward for instructions instead of listening for connections. There are no inbound ports on monitored machines to attack.
Drill into any device to see pending Microsoft KB updates with severity, category, size, and reboot impact. Trigger an on-demand rescan, review patch history, or bulk-install all critical updates from the console. Deployment is permission-gated and explicit. Nothing reboots behind your back.
Sensitive actions are recorded in an audit trail, API keys are scoped and stored hashed, and outgoing webhooks are signed. You can always verify where data came from.
The whole platform runs behind a Cloudflare tunnel with TLS in transit. Nothing is directly exposed to the internet.
Monitoring is read-only. Anything that changes something (restarting a service, pushing a patch, rebooting a machine) requires explicit permission and an explicit command. Nothing happens behind your back.
Alerts are delivered by email or SMS, debounced and de-duplicated so brief blips don't flood your inbox. Every check can be fine-tuned or switched off per device, so you stay in control of what reaches you and how.
A dedicated console for backup health across every source we monitor. ARQ, Veeam, SQLBak, Wasabi, Google Drive, and Microsoft SQL Server. At a glance, see which jobs ran, which are stale, and which need attention.
Open a live PowerShell session against any managed device. No RDP, no SSH, no separate shell. A built-in Quick Commands library covers everyday admin tasks, so you can stop hunting for the right cmdlet.
Two parts of the platform have their own pages, covering what they do and where the boundaries sit.
Netaxis is built and maintained by an operator who runs it in production every day. These are the directions in active development. Priorities, not dated promises.
macOS and Linux are already managed alongside Windows. Installed-software inventory and patch management are Windows-first today, and are being extended to cover those platforms too.
TOTP-based MFA is being added as an optional layer on top of the existing token authentication and role-based permissions.
Netaxis is self-hosted today. A fully managed, hosted-for-you instance is in the works for teams that would rather not run the infrastructure themselves.
Roadmap items reflect current direction and can change. Netaxis intentionally ships features only once they've been proven in real production use.
Get in touch to walk through a live demo, or watch the videos. Happy to talk it through.